Understand your customers’ behavior with in-store analytics
and increase their engagement levels to optimize their path
to purchase!
Heatmap In-Store Analytics allows you to grasp your visitors’ actions within your stores, where they are most attracted to, what they search for and what motivates them to buy. After obtaining this in-store analytics data, you will better know which product line or which zone is performing better and can improve the aspects that lead people to buy.
You can understand the reasons behind the performance of successful areas and apply this knowledge to other areas to see the same or even higher performances. Let our hourly reports tell you how your store performs at different times during the day.
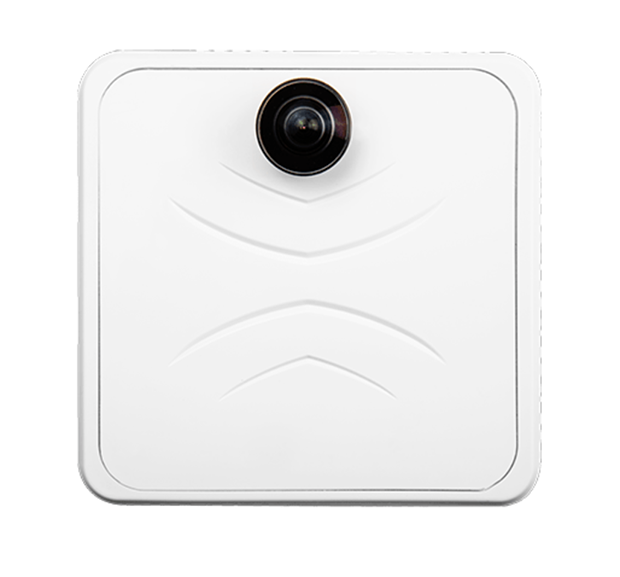
V-Count Heatmap Camera Specifications
| Device Dimensions | (Rectangular Cover): 127x127x38mm |
| Packing Dimensions | 250x167x82mm (WxDxH) |
| Device Weight | 236g |
| Package Weight | 1202g |
| Installation Height | Min. Height 2.2 meters, Max. Height 6 meters |
| POE | IEEE802.3af (48 V DC) 15.4W per port |
| Interface | HTTP / HTTPS |
| Operating System | Linux Based V-Count OS |
| Time | NTP, Adjustable Timezone, Automatic Daylight Saving Adjustments |
| Ethernet Connection | Yes |
| Data Storage | 3 Months of offline storage with auto synchronization |
| User Levels | 3 Levels: Admin, Standard, Guest User |
| Cabling | Cat5 – Cat6 |
| Operating Environmental Specs | Temperature:-15°C to 40°C, Humidity: 10% to 90% |
| Storage Environmental Specs | Temperature: -40°C to 70°C, Humidity: 10% to 95% |
BENEFITS OF HEATMAP ANALYTICS
Realtime Customer Tracking
Track and record the path and actions of your customers within your stores in realtime. This will enable you to understand where they are lingering, and where they are buying.

Improve Store Design
Discover the areas your customers are being attracted to. This in-store analytics information will help you make active decisions about your product placements, lighting and positioning of shelves and mannequins.

Measure Success
By measuring your customers dwell-time with heatmap analysis in certain locations, you can get detailed info about how attractive your new product line is and which products are sold effectively when placed in different areas of your store.

Delist Unattractive Products
Discover which products are not being sold even though they are placed in an active popular area. Delist unattractive products from your popular areas, and improve transaction rates.

Optimize Popular Areas
With heatmap in-store analytics, discover how many of your consumers leave your store after visiting which areas and reduce abandonement by changing up store layout and hotzone attractiveness.

Marketing Effectiveness
Improve marketing effectiveness and profit margins by analyzing the success of your Events, Campaigns and different media channels used in different areas.